| Home | Queens | Honey Production | Employment | Contact Us | Research & Publications | Tours | Items For Sale | Links | FAQs |
ARE INFERIOR QUEENS A RESULT OF CONTAMINATED POLLEN?
By Karen Pedersen and Gil Pedersen of Pedersen Apiaries
I think we’ve all heard or said, “Queens aren’t surviving as long as they used to.” I think we’ve also all heard, “Where are your records to show that? Give us something to start with.” Like every other beekeeper, we have limited time, so we only keep records that have a practical purpose and can tell us something. In 2011, we started to notice a problem in our operation. While we have always kept good records, as the years have progressed since 2011, our records increased to track that particular problem. This is not going to be the story of a nice experiment where we were able to hold variables constant to isolate a certain response. Instead it is a messy story of trying to figure out the answer to a problem through observation, increased record keeping, and trying to make small changes. Our experimentation has the advantage of drawing on a large sample, but because we’re a commercial farm and not an academic research facility, and were looking for a particular desired result (viable queens), that also resulted in certain biases. We surpassed the level of our competence long ago, but until someone else with competence volunteers to help, it will continue to be something that we must endeavor to do. Our purpose in writing this article is first to seek to find out if other beekeepers are seeing similar problems and secondly to find out if there is a researcher out there who might have the answer to our problem.
|
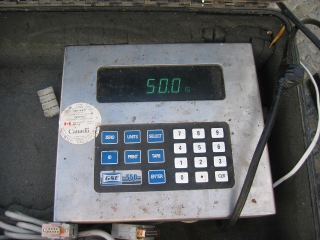
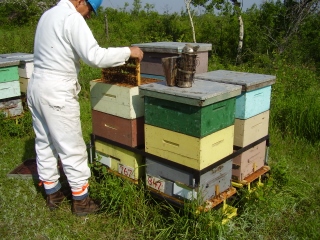
| A scale attached to a Billet Ezyloader is used to track honey production for evaluating queens. |
Pedersen Apiaries is a multi-generational commercial honey producing
operation near Cut Knife, SK. Sometime
in the late 80’s, Pedersen Apiaries started grafting queen cells to raise
queens for our operation. By that point
we were overwintering our bees and it made sense to breed from the best of our
own stock. By the late 1990’s we had
refined our queen raising process. We
bred from queens that had survived 2 winters and had out-produced their
neighbouring/sister hives the summer between those winters. Not only were the winters and poor honey
production culling out poor queens, so were our fingers as we judged them for
not building up in the spring, for being defensive and for showing signs of
diseases. We grafted queen cells into swarm boxes of
bees that are broodless, closed boxes with lots of pollen, liquid honey and
young bees. After 24 hours, the queen
cells were transferred into the top box of cell builder hives. Each cell builder hive was queen-right in the
bottom brood box, which was separated from the top cell box by an excluder and
a honey super. The top cell box had
hatching brood and lots of pollen beside the cells. On day 14, the queen cells were separated and
moved into separate tiny mating nucs to hatch and get mated. From there they were marked and transferred
to our own hives or sold. The only real
change we made to the process occurred somewhere around 2004, when we converted
from using a Jenter comb to graft cells to hand grafting into homemade wax
cups. Raising our own queens had become
an integral part of our commercial honey operation.
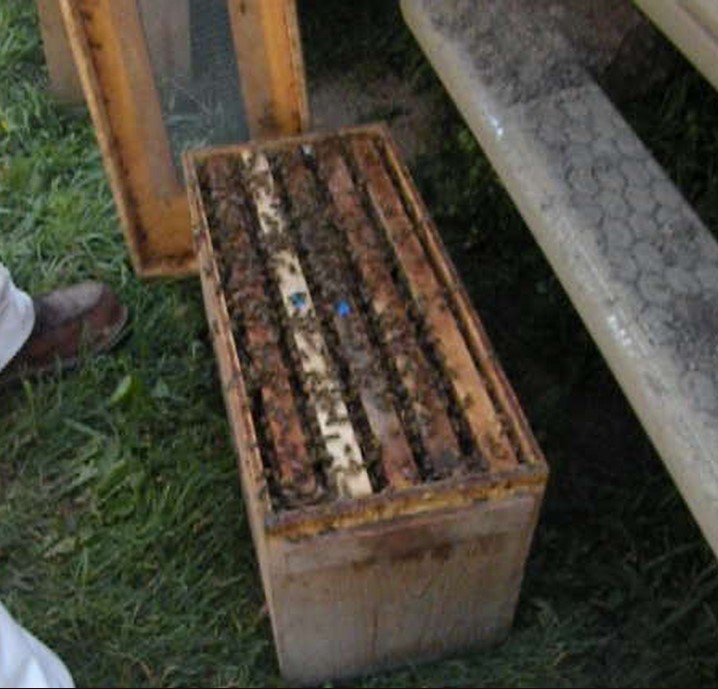 |
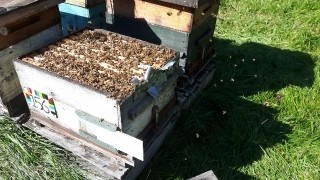
| Lots of young bees are enclosed into swarm boxes with a minimum of 1 comb of pollen and 1 comb of liquid honey. |
2011-12
Typically, we expected at least 75-80% of the queen cells to develop
into full cells. We had no reason to track how many actually did develop
into full cells and so we didn’t. As
long as most of the batches were successful, we were happy. In 2011, the last couple of grafts had a significant
drop in the success rate. We still
didn’t record it because it was the end of the season and it just seemed like a
blip. We had enough queens for the year,
so it wasn’t a huge loss. However, in
2012, our success rate of developing grafted queen cells into full queen cells
had dropped to 30% and I was frantically trying to figure out what was going on.
I was blaming it on the weather, but I also tried changing some other things,
but it was all to no avail.
2013
By 2013, we started systematically trying to figure out and track what
we might be doing that was causing the queen cells to die. We hypothesized that that our equipment was
carrying a virus or other pathogen that was causing the queen cells to
die. We started with new cell combs,
cell bars and wax to make the cell bars, making sure that it was both new wood
and new wax. I disinfected my grafting
tool and the place where I graft. I had
someone else try grafting to see if I had just lost my skill or eyesight. None of these changes had any effect.
We contacted Geoff Wilson M.Sc., P.Ag. Saskatchewan Provincial Specialist in
Apiculture for help. He came to observe and critique our grafting
on June 18, 2013. Geoff said that he
could see nothing wrong with our method.
As per his suggestions, we tried both plastic cups and wax cups to
compare, we tried bee polished and not polished cups and we tried transporting
the swarm boxes at a crawl. We bought a
brand new grafting tool, used fresh water in a glass jar as opposed to a plastic
bottle, and used a new frying pan without a Teflon coating and more new wax to
make new wax cups. He was suggesting
that perhaps we were seeing a residue problem in our process that was ending up
in the water or wax. He also suggested
that we closely observe the cells when they were being transferred from the swarm
boxes to the cell builder hives to determine if the cells were still alive at
the 24 hour stage. We marked those cells
grafted with the changes versus those done in the same way we had always done
them and waited to see if there was any difference.
We determined
that the grafted queen cells were dead within 24 hours of being grafted. They died within the swarm boxes. We learned
that plastic cups gave us a better success rate than wax cups, but still did
not make a huge difference to the success rate.
We ascertained that we still had not identified the cause of the queen
cell deaths. One batch had an 80%
success rate, but we could not correlate it to any changes we had made or not
made. The other batches ranged from a 6%
to 50% success rate and also seemed to have no correlation to the changes made
or not made. The difference in the
plastic cups versus the wax cups was the only clue that led us to looking for
other possibilities of chemical residues that might be making a difference. By that time our short season was over. We thought we had enough queens for
ourselves, but barely.
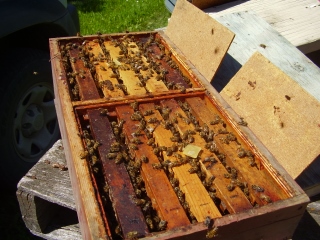 |
| Mating nuc with cells just introduced. |
Unfortunately,
the pain continued the next year as the queens we had raised proceeded to die
over winter or supersede. They just
didn’t last like they should. By this
point, we were tracking the success rate of the queen cells from grafting to
mating nuc, but we still weren’t tracking right from the grafted batch to the queen
in the hive. We knew their parentage, but could not correlate it to the exact
batch of cells and the success or failure of that batch or at what point in the
season they had been raised.
2014
In 2014, we hypothesized that there was a chemical residue in the pollen
being fed to the queen cell larva that was causing them to die. We further hypothesized that the residue was
from a fungicide since the problem of queen cells dying seemed to coincide with
when widespread fungicide spraying of cereal crops and canola began in our
area. We also wondered if nosema spores might be causing the
problem since emerging research on nosema
cerana seemed to indicate that the beekeeping industry understood little
about it.
We collected combs of pollen in the spring of 2014 from our deadouts, separating
it into 2 lots. Lot 1 came from two
beeyards where there was much less availability of cultivated crop land (and thus
canola) for the bees. Lot 2 came from
the rest of our beeyards that are predominantly surrounded by agricultural
cropland. (We will refer to these 2
groupings as Lot 1 and Lot 2 in the rest of the article to refer to the
separation of the pollen by location. In future years, the pollen was mostly
sourced from live hives during the season.)
We collected two random pollen samples from each lot to send to a lab to
be tested for residues. We were unable
to find a lab that could test for all of the possible chemicals that were
sprayed in our area, but we found a lab that would test for a lot of them. The results came back saying that there was no
measurable residue above the acceptable limits in either sample. However, since to my knowledge there is no research
confirming a safe dosage of chemicals fed to apis mellifera larvae (particularly queen larvae), the test told us
nothing useful.
 |
| Queen cells in plastic cups coming out of cell builders. |
The
pollen that we had separated out from the hives in Lot 1 was then used in the swarm
boxes with the grafted queen cells.
Every week, with the exception of one, we prepared the swarm boxes with
pollen from Lot 1 and grafted into plastic cups in our traditional manner. I will admit that because we are still
commercial honey producers, rather than professional researchers, we specifically
used pollen from Lot 1 rather than Lot 2.
Our first goal was to get queens.
Our second goal was to figure out what the problem was and we make no
apologies for that. With the exception of that one week, our success rate
ranged from 75 – 85%. In the one week that was an exception, we used pollen accidentally
from both Lot 1 and Lot 2. That week,
the success rate dropped noticeably, ranging from 30-80% in the different
boxes. This certainly wasn’t a conclusive
answer, but after 2 years of dismal failure, it was enough to give us hope and
encourage us to believe that we might have at least partially identified our
problem. In 2014, we also fed all of
our hives one dose of Fumagillin B in syrup the spring. We then fed 50% of the first batch of swarm
boxes, Fumagillin B while not feeding the other 50%. We could see no difference in the Fumagillin
B feeding.
2015
In 2015, we continued to separate the pollen from the yards into Lot 1 and
Lot 2. Then we used pollen from both lots
in the swarm boxes with the grafted queen cells while tracking where the pollen
was from and what percentage of the queen cells developed into full cells. The lowest batch coming out of the swarm
boxes was 36% which still indicated a problem, but the next lowest was
69%. These 2 low batches were from boxes
that used pollen from Lot 2. In
contrast, the lowest success rates of batches from Lot 1 were 75% and 78%. However, while indicating that we might be on
to something the results were inconclusive because the average success rate
coming out of all of the swarm boxes was 94% and that included pollen from both
Lot 1 and Lot 2.
 |
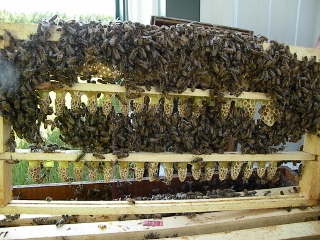
| Cell builder hives. |
So, we weren’t able to recreate a consistently
high death rate of the cells in the swarm boxes. Since realizing that the cells were dying in
the swarm boxes, the cell builder hives had not been of much concern. They mostly raised the live cells that they
received. However, in 2015, cell development in the cell
builder hives became much more inconsistent. The lowest development rate in the
cell builder hives was 8%, and ranged up to 100%, with an average of 76%. We did not have enough collected identified
pollen to use in the cell builder hives, so mostly random unknown pollen was
used in those hives. Therefore, we started to systematically collect pollen
from hives during the summer and fall of 2015 noting where it was from and
during which season it was collected. We
don’t have the capacity or knowledge to identify the pollen microscopically,
but we are in the hives often enough that we can identify pollen by season and
colour with some accuracy. For example,
bright yellow pollen in the spring is most likely willow and would not be
canola, but bright yellow pollen in July would more likely be from sweet clover
or canola, but would not be willow. By this point, we were identifying pollen
as to where it was from, what season it was collected and whether or not it was
canola pollen. We labelled each comb of
pollen by which bee yard it came from and either what type of pollen it most
likely came from or the time of year that it came from. Our hypothesis had narrowed to the point that
we thought it was canola pollen that was the problem. Whether that was because of fungicides,
another type of chemical, or a varietal issue, we had no idea.
2016
By 2016, 5 years after we first noticed the problem, we were now
tracking which pollen we used in both the swarm boxes and cell builder hives and
the percentage of queen cells that were surviving in each. We were now mostly stealing combs of pollen
from live hives and storing it until the next season so that we actually had a
better idea of when it was collected and what it was. We were differentiating and tracking whether pollen
was from Lot 1 and Lot 2, as well as whether it was from spring or summer. We were still prioritizing getting queens
over doing research, but by then we had realized it was also important to track
the pollen right through the life of the queen cell that survived. Was the longevity of the queen determined by
the pollen that it was raised on?
In 2016, the average survival rate coming out of the swarm boxes was
93%, however, the median was 97%. The
average cell development coming out of the cell builder hives was 81% and the
median was 90%. There were only a few
batches that were low in 2016, but 4 batches, in particular were exciting to
find. In 2 of those batches, cells from
two different queen mothers, put into 2 different cell builder hives, dropped
from a 94% success rate coming out of the swarm boxes, to a 50% success rate
coming out of the cell builders. In the
end, from those 2 batches, only 7% of the originally grafted queen cells
survived to become a 2016 queen going into winter. Then other two batches of
cells of note came from the same queen mother.
They were put into a swarm box and came out of the swarm box at a 50%
success rate that further dropped until only 4% of the grafted cells were still
alive to go into mating nucs and none made it to queens. The common denominator between those 4 batches
of cells in both the cell builder hives and the swarm boxes was canola pollen that
came from one beeyard. We had no other
pollen that came from that particular beeyard.
Therefore, we put 2 combs of pollen into cold storage at a research
facility, one from the swarm box with problems and one from a swarm box without
problems. We think we have identified a problem
and maybe even a smoking gun. The
problem now is to find who has the technology to test for what the problem
is. Sending them to a lab that will not
test for everything and will not test below the set acceptable limits is a
total waste of time and money. We are
definitely past our level of competence, but what else can we do?
We
are still learning how to track the pollen straight through from queen
development to the queen longevity. It
has added quite a bit of detail to our record keeping, but it is looking
promising. Obviously, we have to
continue tracking to see whether or not we can find another comb of pollen that
shows such striking differences in queen development. From a research and investigation viewpoint,
the challenge is that the more we learn, the less we want to risk using canola
pollen in queen development.
2017
 |
| Hive ready to be wrapped for winter. |
The winter of 2016-2017 was a long winter with a cold spring which was
hard on our bees. Our losses meant that
we couldn’t afford to risk losing more hives on the possibility of non-viable queens. As a result, we specifically chose to avoid
feeding the combs of pollen that we had collected from Lot 2 or more
specifically we chose to avoid using combs of pollen that we thought might be
predominately from canola. While we couldn’t completely avoid canola in our
area, we tried to avoid using pollen from beeyards with significant exposure to
canola. The average survival rate coming
out of the swarm boxes was 89%, however the median was 94%. The average cell development coming out of
the cell builder hives was 82% and the median was 88%. This year, the lowest
percentage of cells coming out of a swarm box was 56%. That swarm box was fed by summer pollen so we
could not rule out that it had canola pollen in it. The first batches coming out of the cell
builders averaged 58% which we judged was because of the cold spring and the cell
builder hives not being strong enough.
Later in the season, we had only one other batch of cells that stood
out. They dropped to 35% and 56% in the cell
builders that they were put into. Again,
they were fed summer pollen that could have had canola pollen. We neither conclusively proved nor disproved
our hypothesis.
Conclusion
While we know we have a problem, we are a long way from being able to
identify its cause or solution. It would
be easy enough to argue that our hypothesis is doubtful because we still had
problems in 2017. We would like nothing
better than for someone to definitively prove that our hypothesis is
wrong. That would save us countless
hours going down the wrong path trying to track this problem. It would
certainly simplify our lives if we didn’t have to worry about avoiding canola. However, at this time canola pollen is the
only factor that we have been able to identify as possibly holding the key to
answering our problem. At least we have a
large sample size and some of the records that might help narrow the
search. If you have noticed similar
problems, please let us know. It should
be widespread if our hypothesis is correct.
If you have experienced the problem and found a solution, we would really
like to hear that. This isn’t clean academic
research. We are trying to find out if
anyone else is groping around in the dark with us.
Revised: March 1, 2018.
Copyright © 2002 Pedersen Apiaries. All rights reserved. Original Design & Graphics by Karen Pedersen Photographic images are under copyright and used with permission of John Pedersen or Karen Pedersen |